
Machine Learning in Python — From Data to Useful Models
What machine learning does
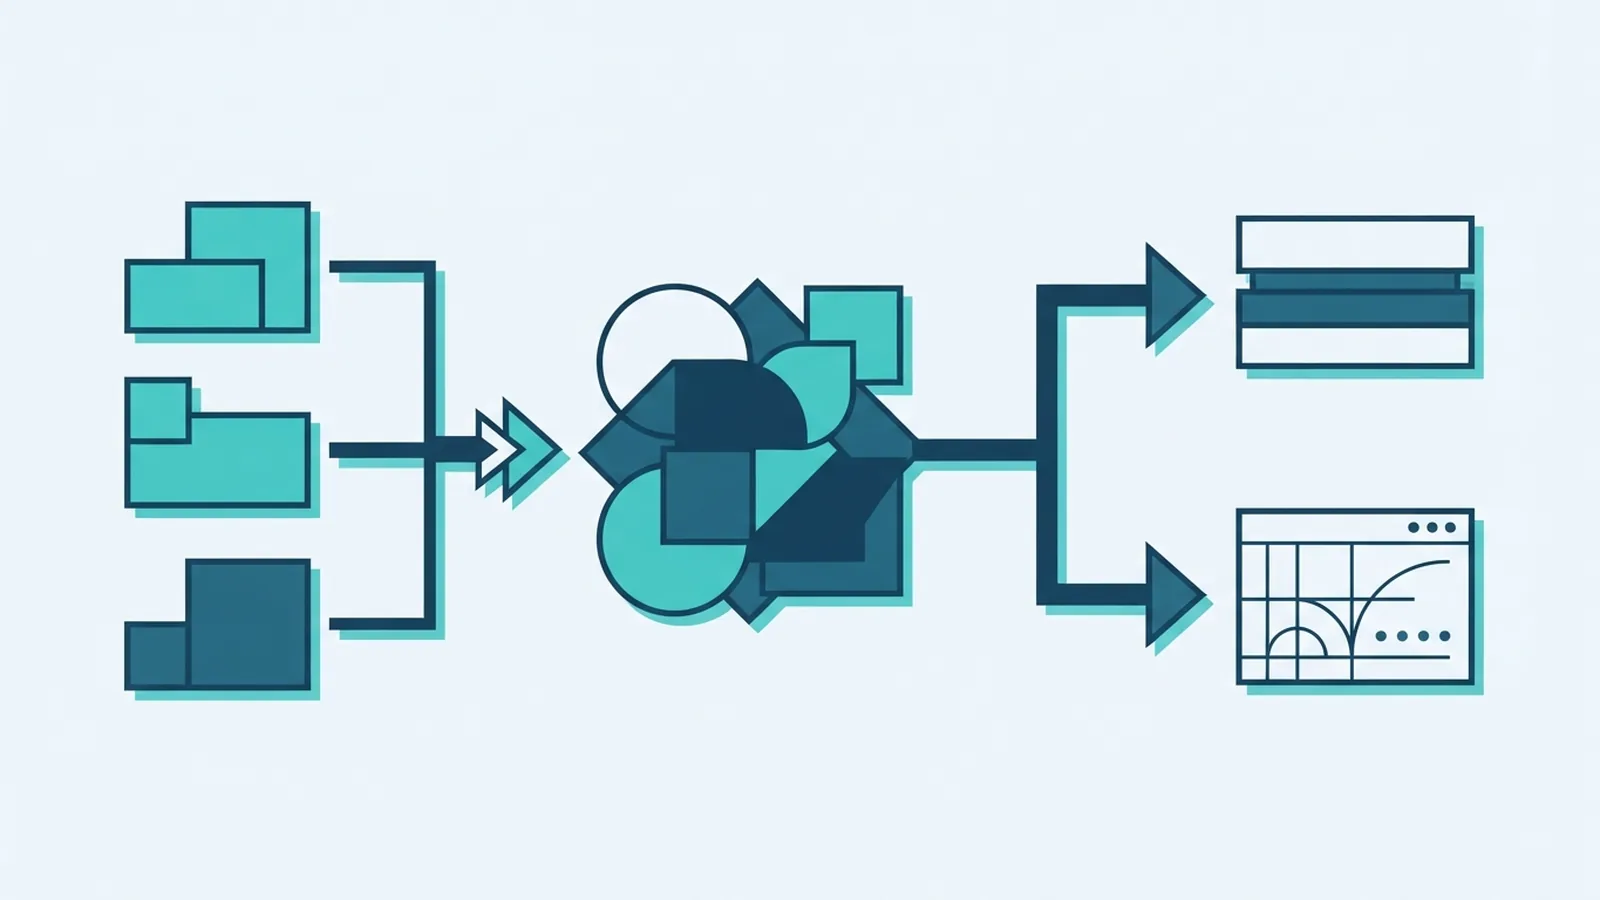
Machine learning using Python means teaching a program to find patterns in data and make useful predictions. You provide examples, choose a model, and test how well it works on new cases. Python offers tools for each step, from preparing data to measuring results.
Machine learning is a branch of artificial intelligence and a core part of data science. It helps teams spot patterns that would be hard to track by hand. For example, a model can estimate house prices from past sales or flag payments that differ from a customer's usual activity.
Two broad learning styles cover many first projects. Supervised learning uses examples with known answers, such as past sales and their final prices. Unsupervised learning looks for patterns in data without supplied answers, such as groups of shoppers with similar habits.
- Supervised: learn from labelled examples to predict a value or class.
- Unsupervised: find groups or patterns without a known answer for each row.
Set up Python for a first project

Use a current Python release and create a separate environment for each project. An environment keeps one project's packages from changing another project's setup. Install Jupyter if you want to run code in small, testable steps.
For a basic data science and machine learning using Python setup, install NumPy, Pandas, Matplotlib, and Scikit-learn. These tools cover arrays, tables, charts, and common models. A terminal command can install them with pip.
Start with a small, known dataset before using business data. Check that Python can load the file and show its columns. Keep a copy of the original data so you can repeat the work if a change goes wrong.
- Make a project folder and create a virtual environment.
- Install the four libraries with pip.
- Load a CSV file with Pandas and inspect its first rows.
- Write down the outcome you want the model to predict.
A clear target keeps the project focused. It also helps you choose the right model and test score.
Pick an algorithm that fits the task

Regression predicts a number, such as next month's demand or a home's sale price. Linear regression is a simple starting point. It estimates how changes in input features relate to a numeric result.
Classification predicts a group or label. A model might sort a support request into a topic or mark a payment as likely fraud. Logistic regression and decision trees are common first choices for classification tasks.
Clustering groups similar records without known labels. A marketing team might use it to find shopper groups from purchase history. K-means is a popular starting method, but you must choose the number of groups before fitting it.
Match the algorithm to the question, not its popularity. For machine learning algorithms using Python programming, Scikit-learn offers a consistent way to fit and compare many models. Begin with a simple model. Add complexity only when test results or business needs justify it.
- Predict a number: try regression.
- Predict a known class: try classification.
- Find natural groups: try clustering.
Prepare data before training

Good data prep often matters more than a clever algorithm. First inspect the size, column types, and sample rows. Look for missing values, duplicate records, impossible values, and labels that do not match.
Then choose how to handle gaps. You could drop rows with very few missing values, or fill gaps with a suitable value. For numeric fields, the median can resist the effect of extreme values better than the mean.
Transform fields so a model can use them. Turn categories into numeric features, and scale numeric values when the method depends on distance or feature size. Keep a record of each change, so the same steps can run on future data.
Feature selection means choosing which input fields to keep. Remove fields that reveal the answer or would not exist at prediction time. Split data before testing feature choices, or results may look better than they will in real use.
Use a pipeline to keep prep steps joined to model training. This reduces the risk of treating training and test data differently. Scikit-learn explains cross-validation and model testing in its official guide.
Measure model results with care
Do not judge a model only by its score on training data. Hold back a test set that the model never sees during training. A common first split uses 80 percent for training and 20 percent for testing.
Accuracy is the share of predictions that are correct. It can mislead when one class is rare. If only one payment in a hundred is fraudulent, a model that always says “not fraud” still gets 99 percent accuracy.
Precision tells you how many flagged cases were truly positive. Recall tells you how many real positive cases the model found. The F1 score balances precision and recall, which helps when both types of error matter.
Pick a metric that fits the cost of mistakes. A health screening model may need high recall, while a costly manual review process may need higher precision. Use cross-validation to test the model across several data splits, not just one lucky sample.
| Metric | What it tells you | Useful when |
|---|---|---|
| Accuracy | Share of all predictions that are right | Classes have similar sizes |
| Precision | Share of flagged cases that are true | False alarms cost time or money |
| Recall | Share of true cases the model finds | Missing a real case is costly |
| F1 score | Balance between precision and recall | Both errors matter |
Use Python's core machine learning libraries
NumPy handles arrays and fast number work. Pandas helps load, inspect, and change table-shaped data. Together, they support much of the data prep that comes before a model is trained.
Matplotlib makes charts for checking distributions, trends, and outliers. A simple plot can reveal skewed values or a small number of extreme records. Use charts to ask clear questions, not just to decorate a report.
Scikit-learn includes tools for prep, regression, classification, clustering, and model checks. Its shared pattern is easy to learn: set up a model, call fit with training data, then call predict on new data. Keep code, package versions, and data notes with the project for repeatable results.
Deep learning uses layered neural networks and often needs more data and computing power. It can suit images, speech, or complex language tasks. For many tabular data science projects, standard Scikit-learn models are faster to build and easier to explain.
Apply models to real-world work
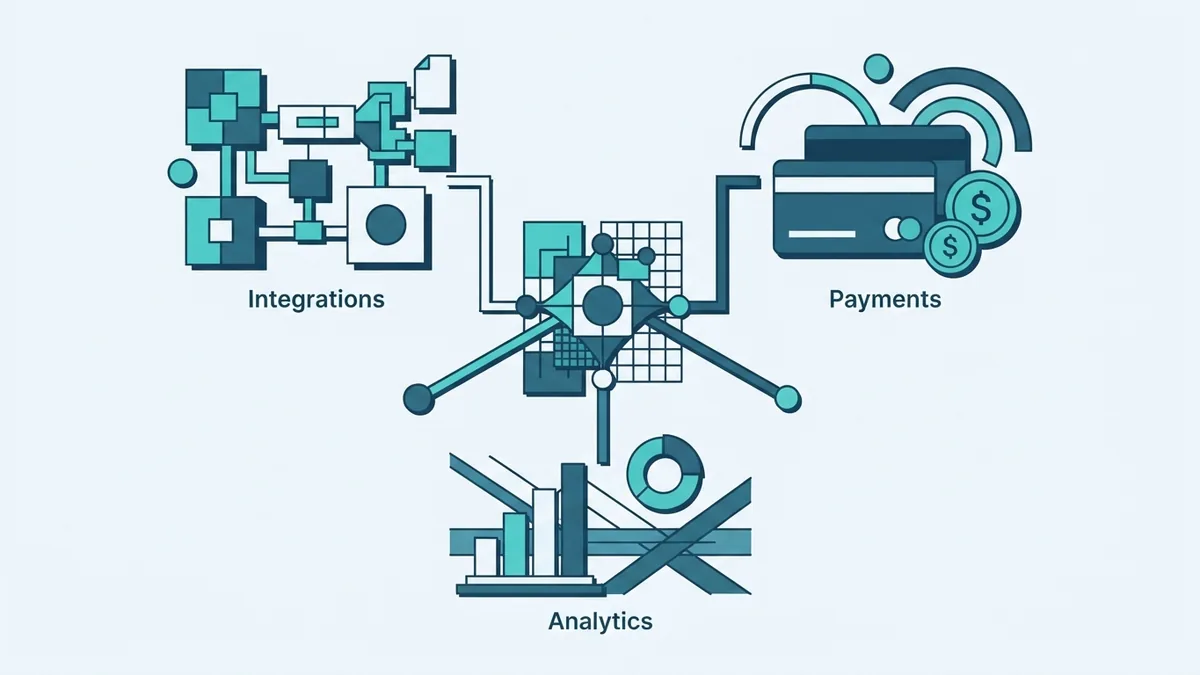
Finance teams can use models to spot unusual payments, estimate credit risk, or forecast cash needs. These outputs should support review, not replace controls or expert judgment. Teams also need to check how errors affect different customer groups.
Healthcare teams can use data to predict readmission risk or help sort scans for review. Such models need strong checks for data quality and safe use. Clinical staff should remain part of decisions that affect care.
Marketing teams can group customers, estimate response to a campaign, or forecast demand. A model might help choose which customers receive an offer. Test that choice against a control group to see whether the campaign caused a real lift.
For any field, begin with a clear question and a useful baseline. Check whether the data reflects the people or events the model will face. Track results after launch, since patterns can shift over time. Machine learning using Python programming works best as a repeatable process, not a one-off notebook.